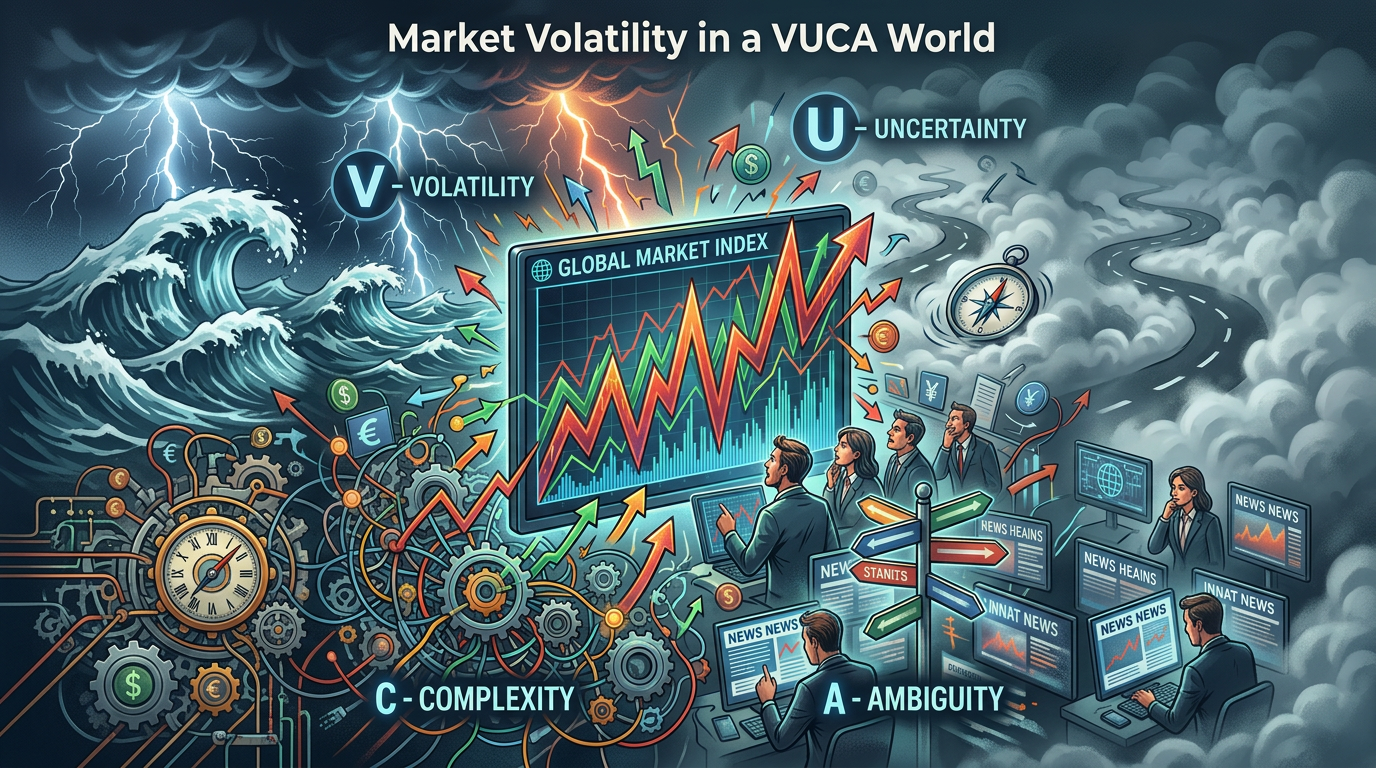
Your first brush with Investing in a VUCA World
Volatile, Uncertain, Complex and Ambiguous.
We are currently living in a classic definition of the VUCA world. Funnily this concept originated from the US Army War College in the 1980s to describe post-Cold War conditions. All those of you who have started your investing journey since covid, this is the first of the several cycles you will be experiencing in your lifetime. As an investor this is the period when you investing skills are stress tested, separating those who panic from those who adapt and thrive. A typical investors journey lasts for about 40- 45 years, assuming you start from the age of 25 to 70 years. If we look at the last 40 years equity journey in India, needless to say there were a lot of highs and lows. Understanding this long-term lens is the single most important insight for new investors.
Here’s the BSE Sensex chart from 1986 to today, with all the major events marked. A few highlights from the journey:

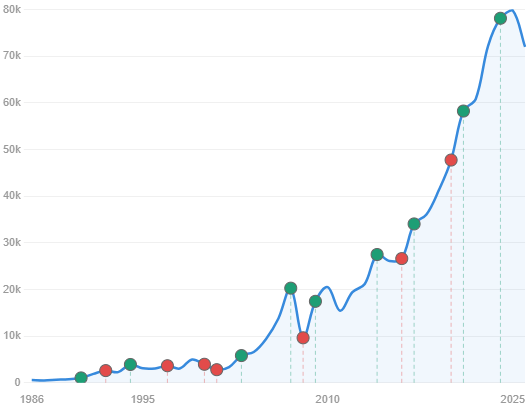

Source: BSE India / Wikipedia. Values are approximate year-end closing levels. Chart by Claude / Anthropic.
The Sensex was introduced in 1986 with a base value of 100 (set in 1978–79), and has since grown from a few hundred points to over 70,000, reflecting India’s economic transformation over four decades.
Key turning points:
- 1990 — First 1,000!
Sensex crossed 1,000 for the first time on 25 July 1990, driven by a good monsoon and strong corporate results. - 1992 — Harshad Mehta scam
The Harshad Mehta securities scam was exposed. Sensex had surged to 4,500 before crashing nearly 50% as the massive bank fraud unravelled - 1994 — Liberalisation boom
Post-1991 economic reforms bore fruit. FIIs entered India and the market surged on privatisation hopes and reform optimism. - 1997 — Asian financial crisis
The Asian currency crisis of 1997–98 triggered regional contagion that weighed on Indian markets, though India was relatively insulated. - 2000 — Dot-com bust
The global dot-com bubble burst. The IT-heavy Sensex fell sharply as tech valuations collapsed worldwide. - 2001 — Sensex crash – 9/11 & Ketan Parekh
The 9/11 attacks and the Ketan Parekh stock scam compounded market woes, pushing Sensex to multi-year lows. - 2003 — Bull run begins
A historic bull run began in 2003 as India’s IT sector took off, FII inflows surged, and GDP growth accelerated toward 8%. - 2007 — Crossed 20,000!
Sensex crossed 20,000 for the first time in Oct 2007, driven by the global credit bubble, FII euphoria, and India’s booming economy. - 2008 — Global financial crisis
The Lehman Brothers collapse triggered a global meltdown. Sensex crashed from ~21,000 to below 8,000 — a loss of over 60% in less than a year. - 2009 — UPA re-election rally
Congress-led UPA’s surprise election victory sparked a massive single-day 2,100-point rally. Satyam fraud recovery also helped stabilise sentiment. - 2014 — Modi wave
BJP’s landslide election victory in May 2014 triggered a sharp rally. Sensex crossed 25,000 for the first time as markets priced in reform optimism. - 2016 — Demonetisation shock
PM Modi announced sudden demonetisation of ₹500 and ₹1,000 notes in Nov 2016, sending markets and the economy into short-term turmoil. - 2017 — GST & reform rally
GST rollout and strong corporate earnings drove the index to record highs above 34,000. - 2020 — COVID-19 crash
The pandemic triggered the fastest-ever bear market. Sensex fell from ~42,000 to below 26,000 in March 2020 — a 38% crash in weeks — before a dramatic recovery. - 2021 — Post-COVID boom
Vaccine rollouts, fiscal stimulus, and retail investor surge powered Sensex above 58,000. - 2024 — Sensex @ 80,000+
Sensex crossed 80,000 in July 2024, and hit an all-time high of ~85,836 in September 2024, driven by domestic flows and strong corporate earnings.
And today we are hovering around 77000 after hitting 85700 in January 2026. The lesson? Volatility is the inherent nature of equity markets and not in your control. What is in your control is your behaviour. How you navigate this journey will determine if you are successful or not. The same principles of the VUCA framework used in military strategy applies to investing – Vision, Understanding, Clarity, Agility.
- Counter Volatility with Vision: Set a clear direction to weather sudden disruptions. Have a clear financial plan with goals set in it, define your asset allocation and keep reviewing it periodically. Vision prevents panic selling during market crashes
- Counter Uncertainty with Understanding: Understand your risk- taking capacity, 99% of us don’t need to invest in very high-risk products. Stick to basics. Know what you’re investing in, ask questions, read and understand before committing capital.
- Counter Complexity with Clarity: Keep your investment process simple, there is no need for complex products, all you need is disciplined and consistent investment.
- Counter Ambiguity with Agility: Market downturns are not disasters; they are discounts. During market crashes, equity investments go on sale. Be agile enough to invest additional amounts during dips, while never losing sight of your overall plan and risk profile.
Conclusion: There Is No Perfect Time to Invest; Only the Right Approach
If we continue to hold off on investing until we have stable and predictable conditions, we may never find those circumstances, as the world doesn’t develop in a straight line. There’s no avoiding the VUCA world, only adapting to it.
Disclaimer: This article is for educational purposes only and does not constitute financial advice. Past market performance is not indicative of future results. Please consult a SEBI-registered financial advisor before making investment decisions.

Leave a comment